Cluster Agreement Fit Statistic
Source:vignettes/cluster_agreement_fit.Rmd
cluster_agreement_fit.RmdData preparation…
data(penguins, package = 'datasets')
cluster_vars <- c('bill_len', 'flipper_len')
penguins <- penguins[complete.cases(penguins[,cluster_vars]),] # Two observations with missing values
Standardize our two clustering variables…
penguins <- penguins |>
    dplyr::mutate(dplyr::across(all_of(cluster_vars), clav::scale_this))
Clearly there are three clusters…
ggplot(penguins, aes(x = bill_len, flipper_len, color = species)) +
    geom_point()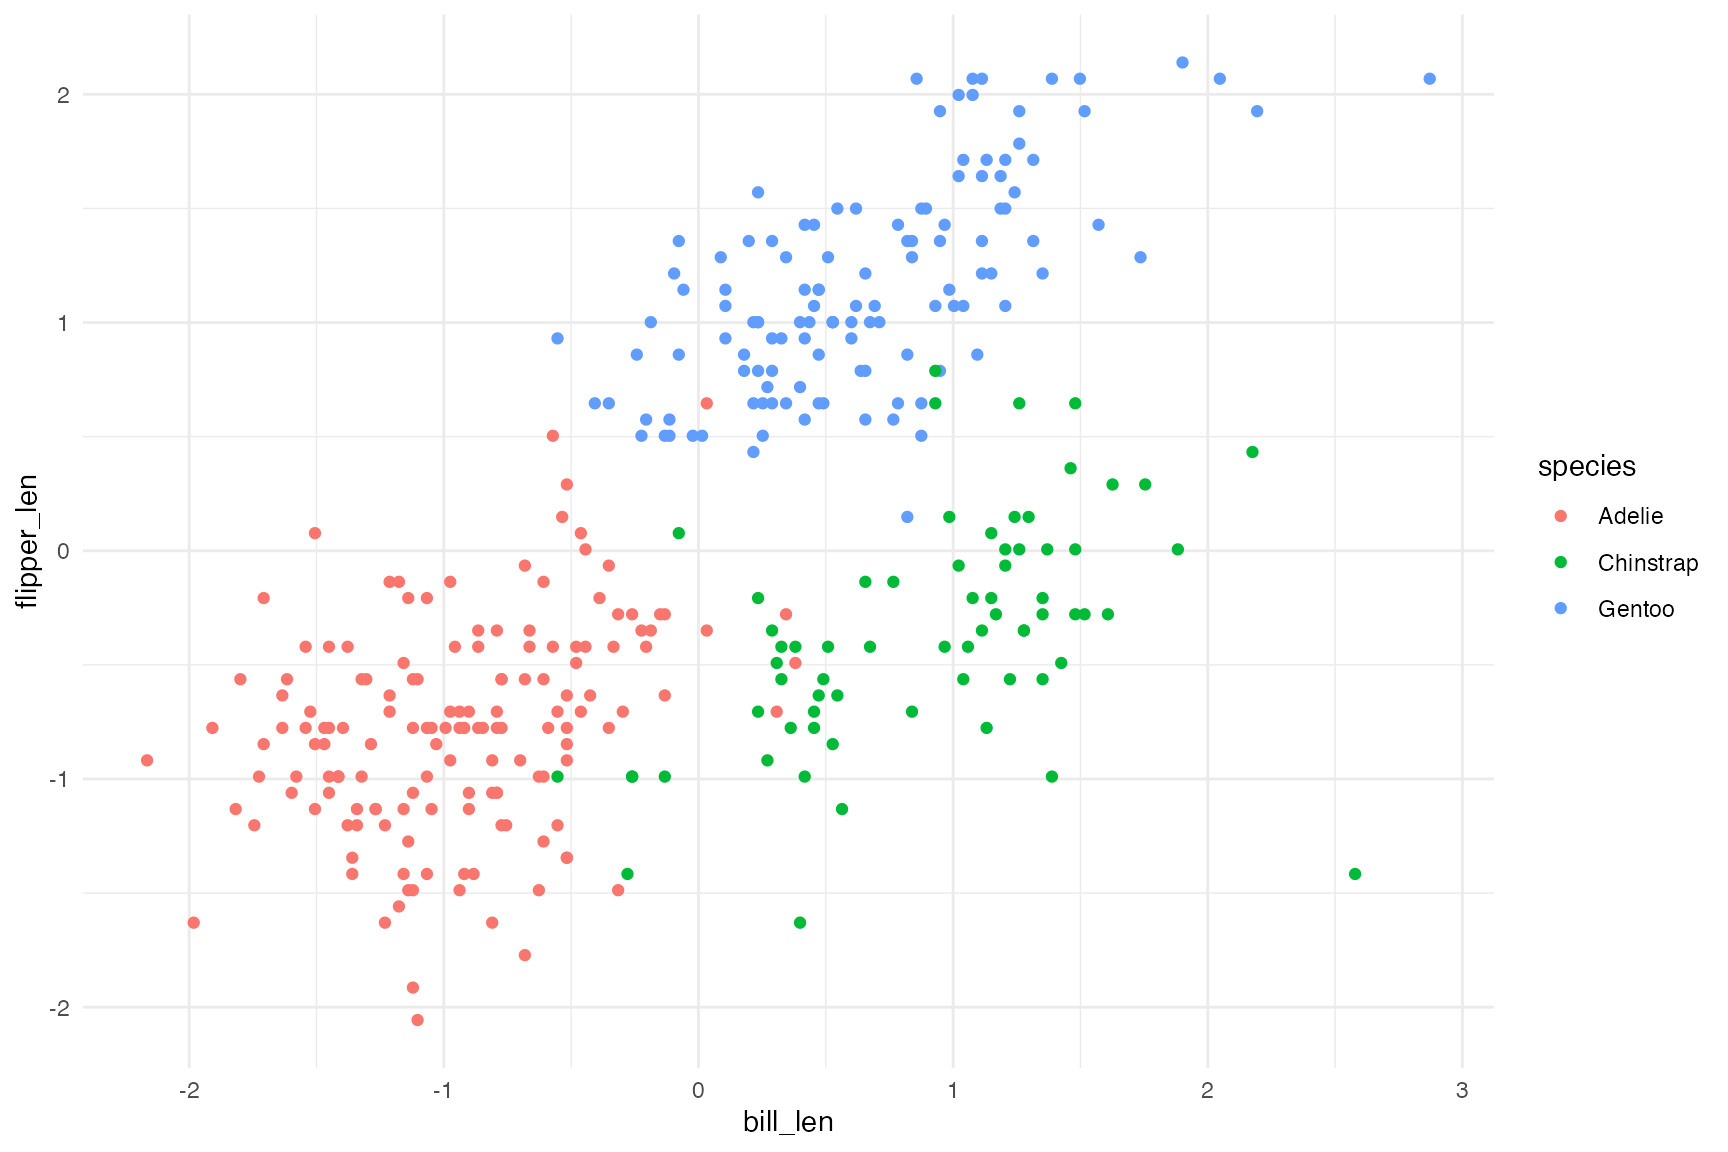
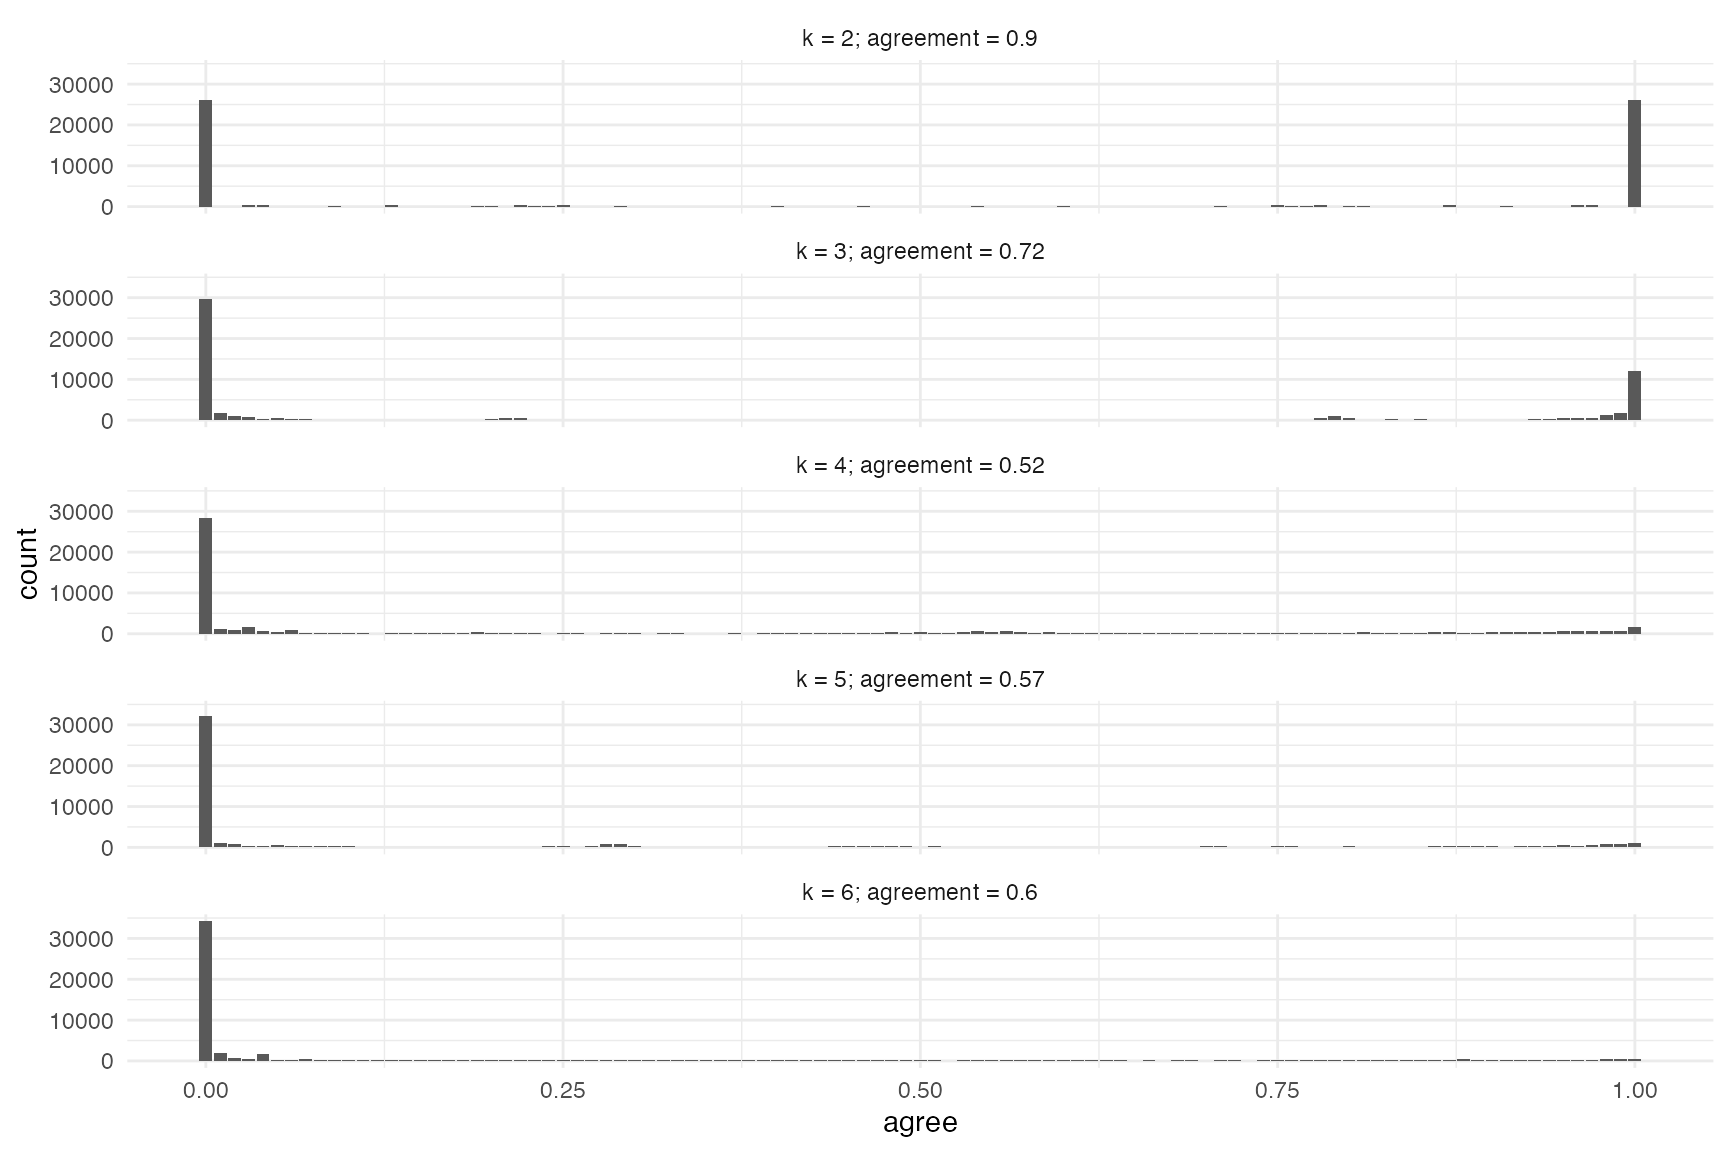
The cluster_agreement_fit() function will call the
cluster_validation() function for varying number of
clusters (i.e. k, default will be 2 to 6). Additionally, it will
calculate the overlap in cluster membership for each pair of
observations.
penguins_caf <- cluster_agreement_fit(penguins[,cluster_vars] )
summary(penguins_caf)
#>    k       fit
#> k2 2 0.8974122
#> k3 3 0.7173604
#> k4 4 0.5164034
#> k5 5 0.5709900
#> k6 6 0.5951021
plot(penguins_caf)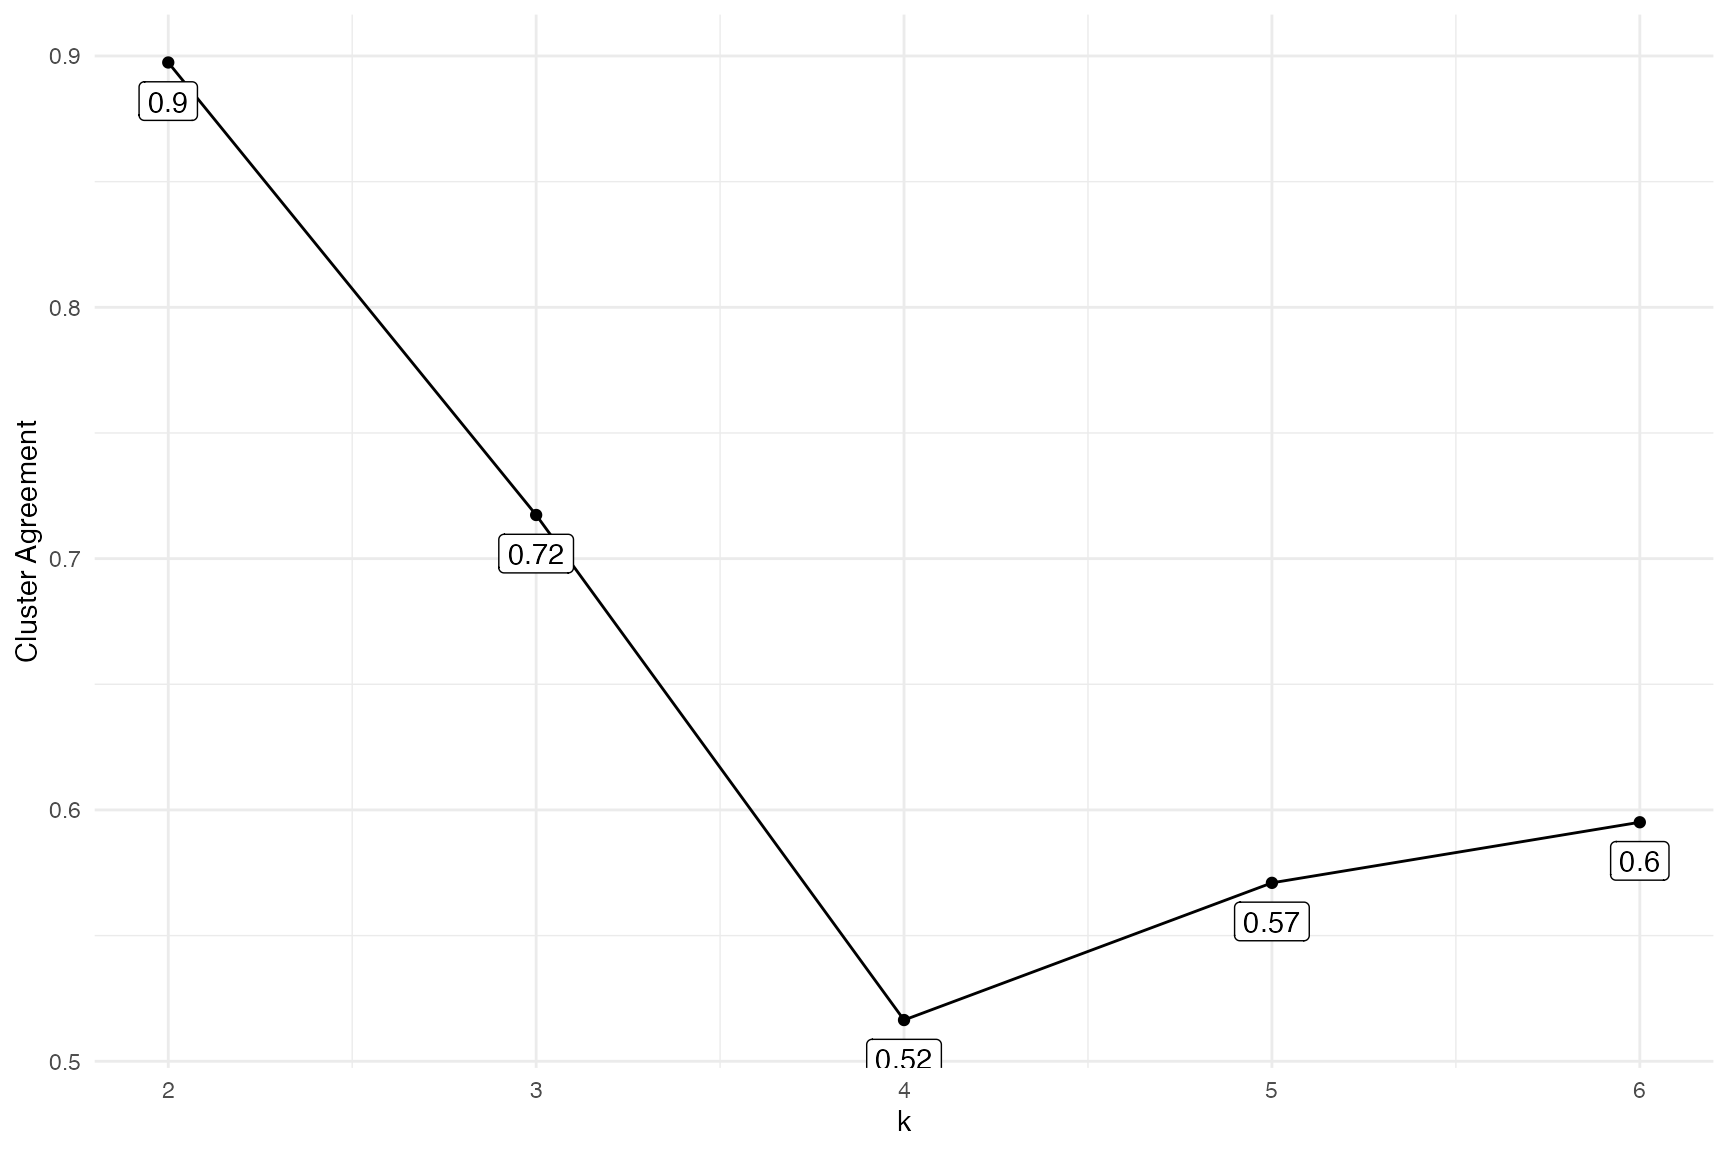
hist(penguins_caf)